
Open in app: Reports → Finance. Available to Admins and Owners.
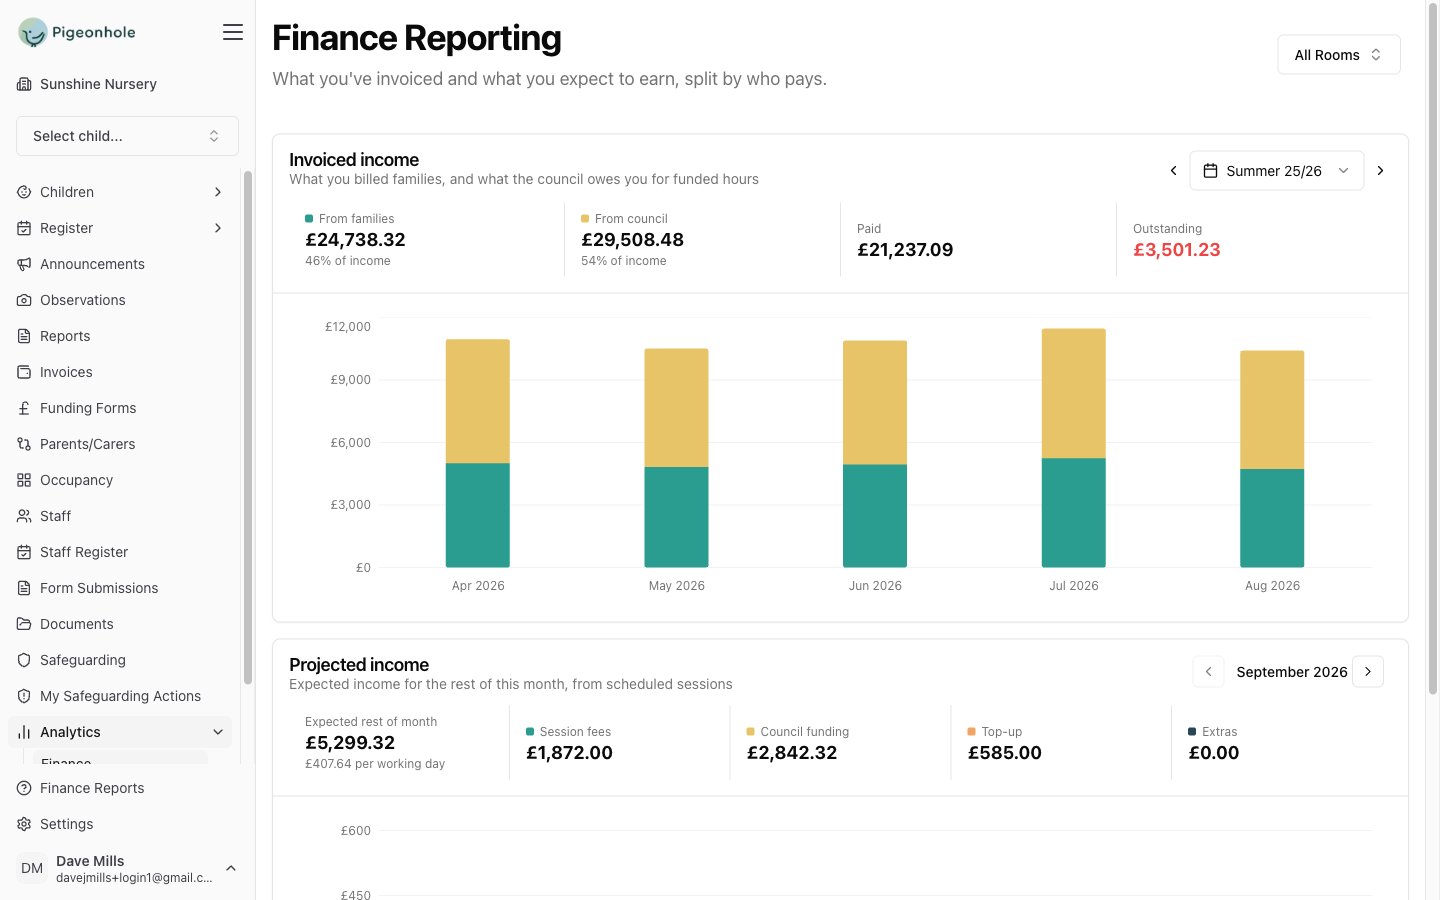
Filtering by room
The Room selector sits in the page header, beside the heading, and scopes both charts at once. Leave it on All Rooms for a whole-site view, or pick a room to see what that room invoices and is expected to earn.There is one room filter for the page rather than one per chart, so the two charts can never drift out of step and be read as contradicting each other.
Invoiced income
This is money you have already billed, broken down by month across the selected term.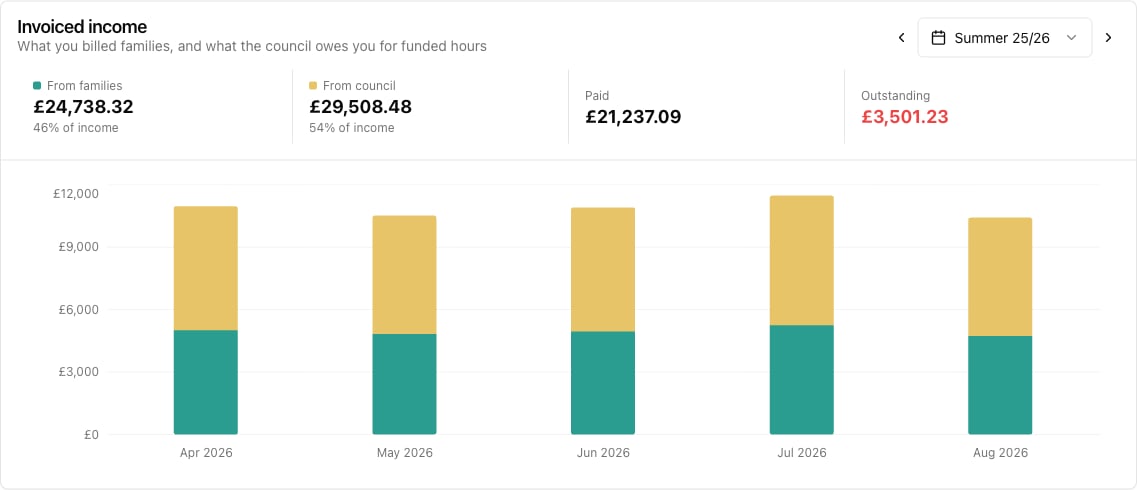
- From families — what you billed parents for sessions and extras, with its share of total income.
- From council — what the council owes you for funded hours, with its share.
- Paid — how much of the total has been settled.
- Outstanding — how much is still unpaid, shown in red.
How council income is worked out
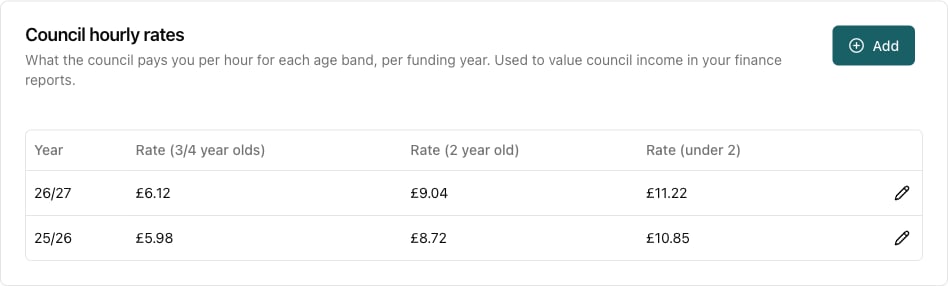
This is the part most nurseries can’t easily see anywhere else. Council income is not an estimate or a national average — it’s calculated from your own council rates:- Every invoiced session line carries the number of funded hours it used.
- Each child is placed in an age band — under two, two-year-old, or over two — based on their age at the start of the funding year (1 September), which is how councils fund a child for a whole year.
- Those hours are multiplied by your hourly rate for that band and funding year.
Set your rates under Settings → Funding → Council hourly rates. They’re always in use for this chart — you do not need to use funding forms for council income to appear.
Projected income
The projection looks forward instead of back: what the sessions already in the diary are expected to earn.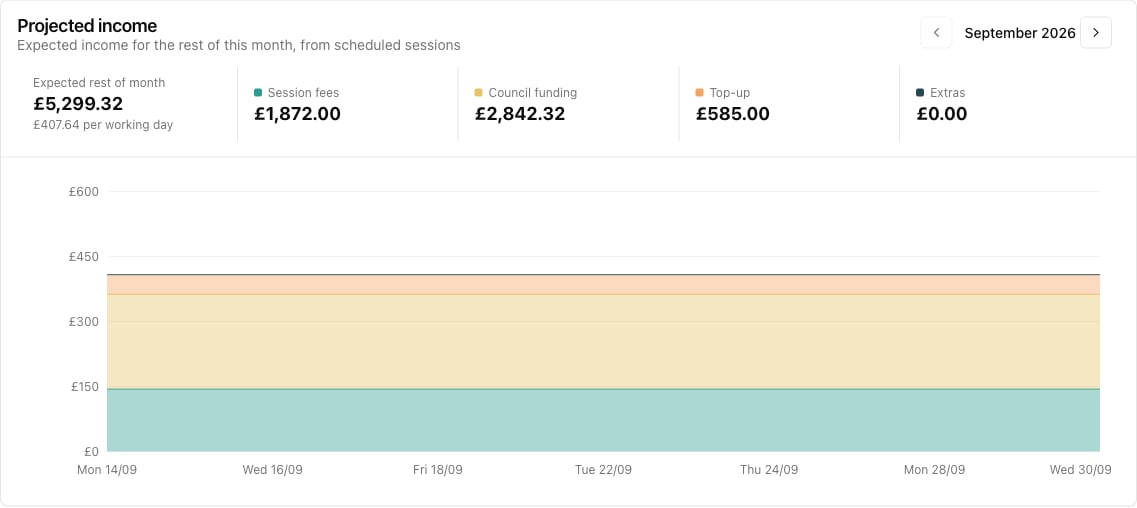
- Session fees — what families pay for booked sessions.
- Council funding — the value of funded hours in those sessions.
- Top-up — what families pay above their funded entitlement.
- Extras — extra charges such as meals, nappies or clubs.
- It only goes forwards. Once a month has been invoiced, the invoiced chart above is the accurate record, so the projection never contradicts it by looking back.
- It stops three months out. Sessions beyond that are too provisional to be worth forecasting.
- The current month starts from today. Income already earned this month is on the invoiced chart, so counting it again would double it up.
- Weekends are left out rather than plotted as zero, which would draw cliffs that read as a collapse in income.
Funding distribution
If your setting uses funding forms, a separate Funding report shows the estimated value of government funding for a term, based on your approved funding forms.Open in app: Reports → Funding. This page only appears when funding forms are switched on for your setting.
- Under Two
- Two Year Olds
- Over Two
What’s included
Totals come from approved funding forms only. Two notes can appear next to the heading:- A help icon telling you how many approved forms the figure is based on.
- An amber warning telling you how many unapproved forms were excluded. Approve them to bring them into the totals.
- “No funding forms are available for this term” — no forms cover the selected term.
- “Funding rates for this year have not been set” — add the year’s rates under Settings → Funding.